HighSpeedOptions prides itself on providing honest, quality content. While we may be compensated when you make a purchase through links on our site, all opinions are our own. Here's how we make money.
The internet in the U.S. is nearly ubiquitous, but not uniformly accessible. Speeds continue to rise, device habits keep shifting, and affordability programs have changed. This page distills the latest signals into a fast, factual overview you can scan in a minute and explore in depth by section.

Who Has Access to Modern Broadband (100/20 Mbps)?
Most U.S. residents have access to the Federal Communications Commission’s (FCC) minimum broadband benchmarks of 100 Mbps download and 20 Mbps upload. But rural access gaps persist.
| Metric | U.S. Share | Rural Share |
| U.S. population with access to fixed broadband | 94% | 72% |
| Metric | U.S. population with access to fixed broadband |
| U.S. Share | 94% |
| Rural Share | 72% |
Methods: The BDC reflects availability reported by internet providers, not measured performance.
How many people use the internet, and how are they connecting?
About 95% of U.S. adults are online, 80% have home broadband, and 90% own a smartphone as of August 2025. Of those adults, 15% are smartphone-only (own a smartphone but not home broadband), which is adequate for quick access but limiting for homework, uploads, and large files.
How often do U.S. adults go online?
Adults are online. A lot. The chart below shows the online activity of adults captured by a self-reported internet use frequency survey from the Pew Research Center in 2024.
| Metric | Share |
| Adults who are online almost always | 41% |
| Adults who go online every day | 90% |
| Adults who do not use the internet | Less than 5% |
| Metric | Adults who are online almost always |
| Share | 41% |
| Metric | Adults who go online every day |
| Share | 90% |
| Metric | Adults who do not use the internet |
| Share | Less than 5% |
What is the U.S. median fixed broadband speed?
U.S. median fixed (not mobile connectivity) internet speed was 285.6 Mbps download and 49.2 Mbps upload in August 2025. (Source: Ookla’s Speedtest Global Index)
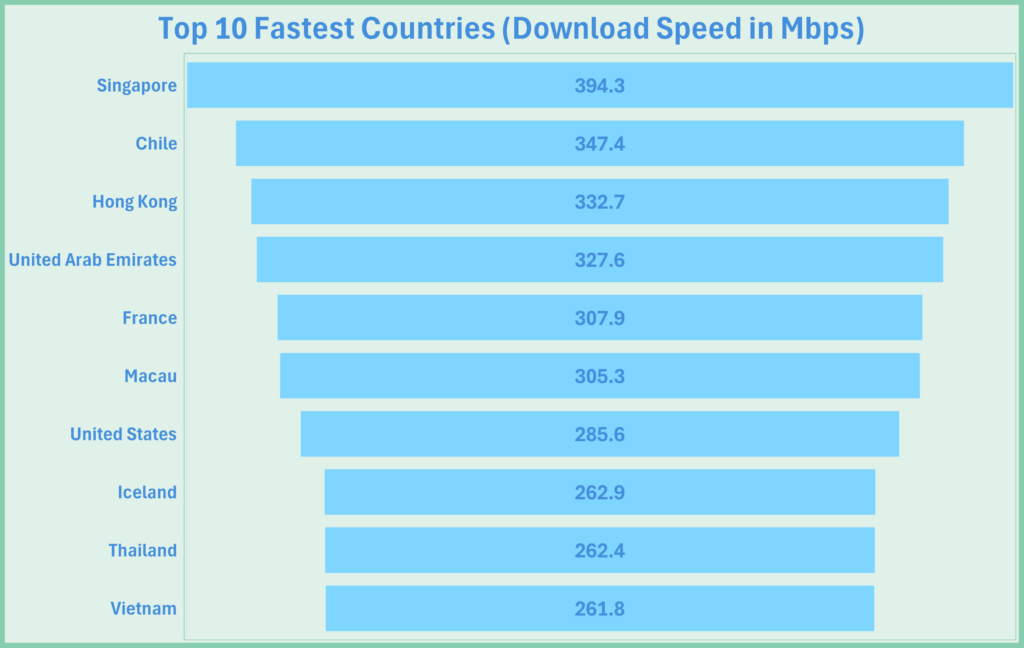
Top 10 Fastest Countries by Average Download Speed
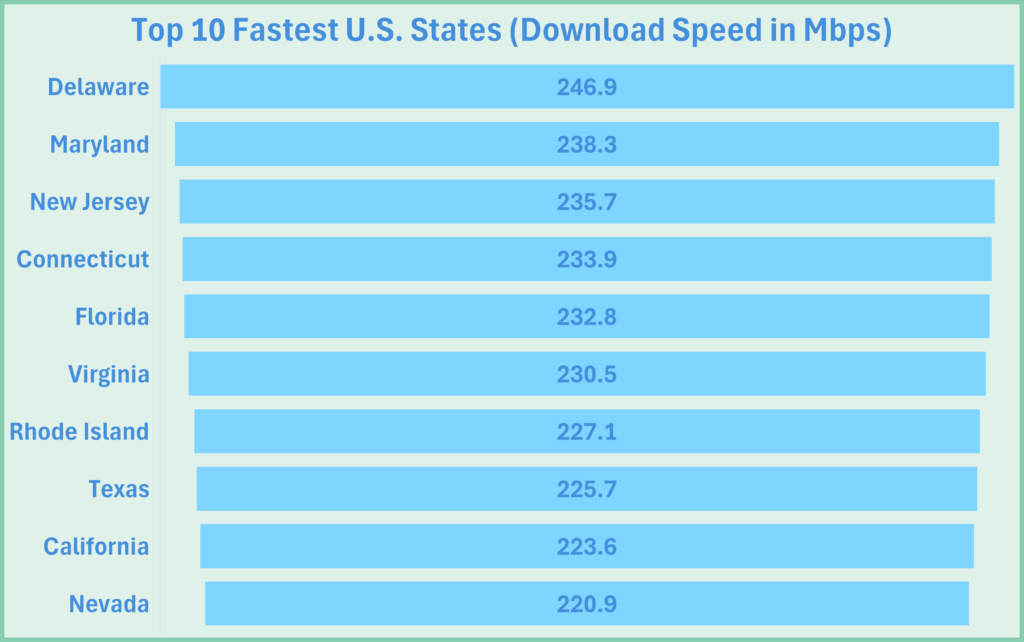
Top 10 Fastest U.S. Cities by Average Download Speed
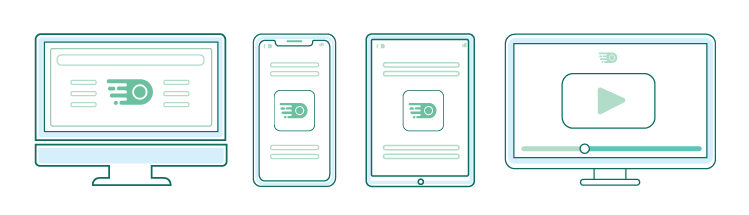
Are Americans browsing more on desktop or mobile?
In September 2025, almost 55% of connections were from desktops, about 45% from mobile devices, and less than 10% were from tablets.
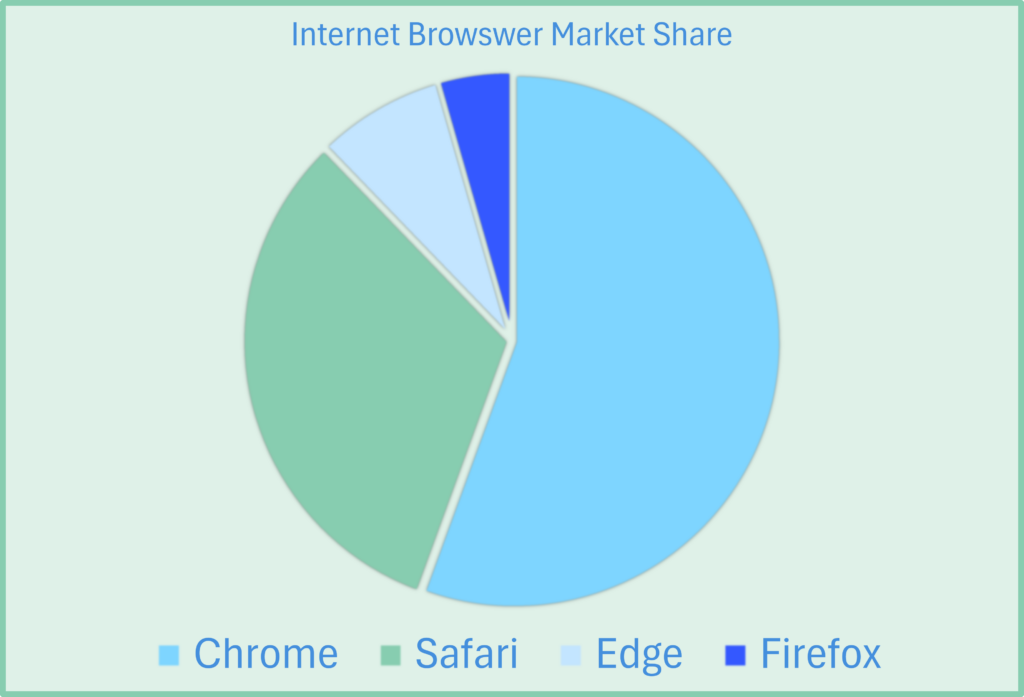
U.S. Browser Share (September 2025):
- Chrome: 53%
- Safari:29%
- Edge 7%
- Firefox: 4%
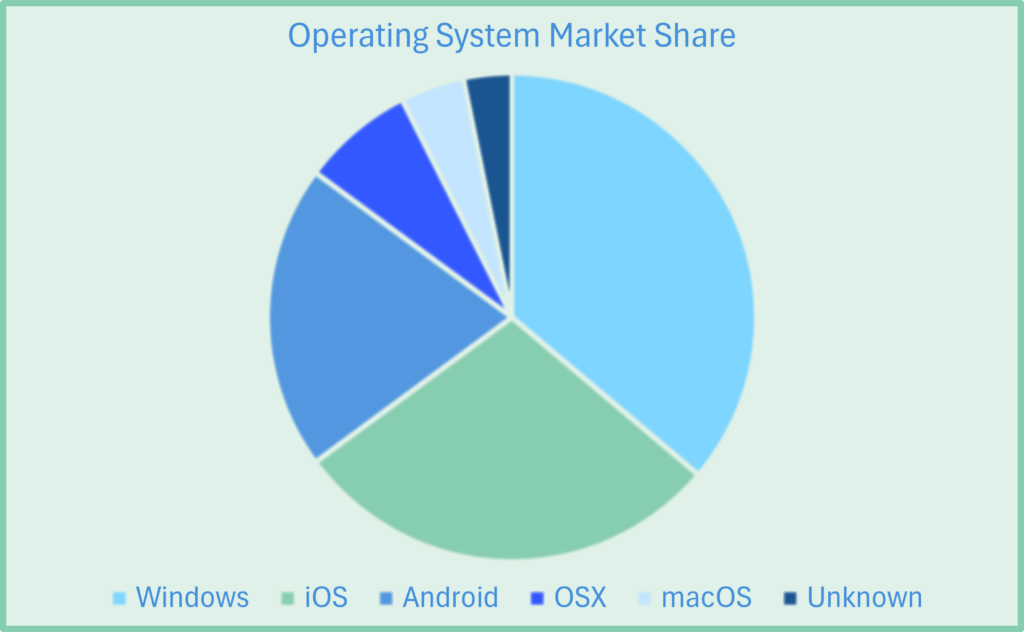
U.S. Operating System Share (September 2025):
- Windows: 34.26%
- iOS: 27.21%
- Android: 19.34%
- OS X: 7.11%
- macOS: 4.32%
- Unknown: 2.59%.
What happened after ACP ended, and what discounts are available?
The Affordable Connectivity Program (ACP) ended June 1, 2024, but new applications and enrollments into the program closed on February 7, 2024. As a result, millions of Americans lost or received reduced discounts as program funds expired. Point readers to remaining options.
Alternatives to the ACP do exist, though. Below are a few ways to help manage internet costs.
Internet Service Financial Relief and Assistance Options
| Program | Who qualifies | Typical benefit | How to apply |
| Lifeline | Income ≤135% FPG or participation in SNAP, Medicaid, SSI, Veterans Pension, Federal Public Housing, or Tribal programs | Up to $9.25/mo discount on phone or internet; up to ~$34.25/mo on Tribal lands | Check eligibility, choose a participating provider, apply via National Verifier, and enroll with the provider. |
| Provider Low-Income Plans | Income-based; often participation in SNAP/Medicaid or student/senior status; varies by ISP and location | Discounted broadband (typ. 25–100+ Mbps) with flat pricing and no contracts/equipment fees (varies) | Plans vary by provider. Visit our fixed income internet guide for a list of available plans. |
| State & Local Initiatives | Varies by state/city: income limits, student households, seniors, Tribal members, public-housing residents | Vouchers, bill credits, device hotspots, or subsidized plans; amounts and duration vary | Check your state’s broadband office, city programs, libraries, and housing authorities. |
| Program | Lifeline |
| Who qualifies | Income â¤135% FPG or participation in SNAP, Medicaid, SSI, Veterans Pension, Federal Public Housing, or Tribal programs |
| Typical benefit | Up to $9.25/mo discount on phone or internet; up to ~$34.25/mo on Tribal lands |
| How to apply | Check eligibility, choose a participating provider, apply via National Verifier, and enroll with the provider. |
| Program | Provider Low-Income Plans |
| Who qualifies | Income-based; often participation in SNAP/Medicaid or student/senior status; varies by ISP and location |
| Typical benefit | Discounted broadband (typ. 25â100+ Mbps) with flat pricing and no contracts/equipment fees (varies) |
| How to apply | Plans vary by provider. Visit our fixed income internet guide for a list of available plans. |
| Program | State & Local Initiatives |
| Who qualifies | Varies by state/city: income limits, student households, seniors, Tribal members, public-housing residents |
| Typical benefit | Vouchers, bill credits, device hotspots, or subsidized plans; amounts and duration vary |
| How to apply | Check your stateâs broadband office, city programs, libraries, and housing authorities. |
- Lifeline: Ongoing federal benefit that reduces monthly phone or internet bills for eligible households based on income or participation in programs like SNAP, Medicaid, SSI, or Tribal assistance.
- ISP low-income plans: Provider-run discounted internet offers (e.g., Internet Essentials, Access from AT&T) with simple eligibility, flat pricing, and speeds suitable for everyday work and school.
- State & local initiatives: Location-specific vouchers, discounts, or digital-equity programs (often via broadband offices, libraries, or housing authorities) that can complement federal and internet provider options.
For more information on these alternatives and eligibility, see our resource on low and fixed-income internet options.
Why do people skip home internet?
Some Americans opt out of home internet due to limited access, cost, or choose to rely solely on smartphones.
Access: By the FCC’s current 100/20 Mbps benchmark, about 94.1% of the U.S. population has access to fixed broadband (BDC Dec 2022). For comparison, about 72% of rural residents have access to broadband minimums.
Affordability: According to the Pew Research Center, roughly one in five adults lacks home broadband, and non-adopters frequently cite monthly cost among their reasons; meanwhile, industry data show prices declining as speeds increase.
Smartphone-only: The Pew Research Center also reported in 2024 that around 15% of adults rely on a smartphone without home broadband.
For context, that’s about 50 million people who choose to solely use their smartphones at home rather than subscribe to broadband service. s technology becomes more efficient, we’ll see more people opt for smaller devices as a means to connect to the internet.
Final Thoughts: A Connected But Divided U.S.
America’s internet picture is strong and improving, but uneven. Access at modern benchmark speeds has expanded, typical speeds keep climbing, and most adults are online. Rural availability lags in higher-tier plans, uploads still trail downstream gains, and the end of ACP reshaped affordability for many households. For more information about the internet access gap, visit our U.S. Digital Divide resource.
What it means for readers
- Choose by use case: For multi-user homes with video calls, cloud backup, and creator workflows, target plans that comfortably meet or exceed 100/20 Mbps, with extra headroom for uploads.
- Mind the device reality: Design, test, and budget for a desktop + mobile world; each dominates different tasks.
- Check affordability options: With the end of the ACP, take a look at Lifeline, internet provider low-income plans, and state or local aid; eligibility and pricing change, so verify current terms.
What to watch next
- Buildout & BEAD deployments: Expect availability shifts as projects complete; revisit the Access & Availability module for new vintages.
- Upstream improvements: More symmetrical tiers and fiber builds could narrow the upload gap.
- Pricing dynamics: Promotional pricing and low-income offers evolve; we’ll update the Affordability table as programs change.
- Measurement differences: Keep reading captions and methods—BDC availability, measured performance, and provisioned speeds answer different questions.
To find internet providers near you, enter your zip code below!
FAQs: Current State of Internet in the U.S.
The most telling statistic is that 95% of adults are online, meaning 1 in 20 adults do not use the internet. Of the 95%, 15% connect to the internet using only their smartphone, while 80% use home broadband. The median internet speeds in the U.S. are 286 Mbps download and 49 Mbps upload.
It depends on the metric—median speed, upload, latency, jitter, fiber availability, consistency, and price. Let’s use the most common qualifier: speed. In 2024, Ookla found that Connecticut had the fastest average download speed at 273 Mbps. North Dakota had the fastest upload speed at 93.09 Mbps. These averages are for fixed broadband, not mobile.
In the U.S., mobile accounts for about 45% of web traffic, while desktop accounts for roughly 55%. Nearly 9 in 10 adults own a smartphone in the U.S., and 15% rely only on smartphones to access the internet.
The FCC’s current benchmark is 100 Mbps download and 20 Mbps upload for fixed broadband.
Roughly 94% of the U.S. population has access, while rural availability is closer to 72%. See Who Has Access to Modern Broadband (100/20 Mbps)?
Rural internet options are scarce due to lower population density, which reduces ROI on build-out costs and slows fiber or cable deployment. Funding programs (e.g., BEAD) aim to close those gaps.
Availability (e.g., FCC BDC) shows where providers say a service can be installed; it’s not a speed indicator. Performance reflects measured speeds from users or test platforms.
As of August 2025, the U.S. median fixed internet speed was 285.6 Mbps download and 49.2 Mbps upload. That’s median performance, not a guaranteed plan speed.
Check Lifeline, internet provider low-income plans (e.g., Internet Essentials, Access from AT&T), and state/local initiatives. Eligibility varies; verify details with the specific program and provider.
Enter your ZIP code in our internet provider search tool to view available providers and plans near you. Here you can compare prices, speeds, data policies, and more.


![Rural Internet Options [Guide]](https://www.highspeedoptions.com/wp-content/uploads/2021/12/New-RuralInternet-Graphic.png)


![Rural Internet Options [Guide]](https://www.highspeedoptions.com/wp-content/uploads/2021/03/CTL-ASALogo.png)